


Benchmarking software that allows you to easily measure CPU, GPU and storage performance.Crystal Mark RetroReleased on March 31, 2024. CrystalMark Retro is a storage performance benchmarking softwareCrystalDiskMark“Storage management software”Crystal Disk InformationIt is a creator of standard programs such asThe sameSince it's his new work, I feel like CrystalMark Retro will also become standard software. I have reviewed the steps to download CrystalMark Retro and measure the performance of your computer.
Crystal Mark Retro – The World of Crystal Dew [ja]
https://crystalmark.info/ja/software/crystalmarkretro/
To download CrystalMark Retro, first click on the link below.
Download – Crystal Dew World [ja]
https://crystalmark.info/ja/download/#CrystalMarkRetro
On the download page, you can find the regular version of the official support character of CrystalMark Retro and CrystalDewWorld”Blue crystal“Aoi's version was released with the theme and sound.
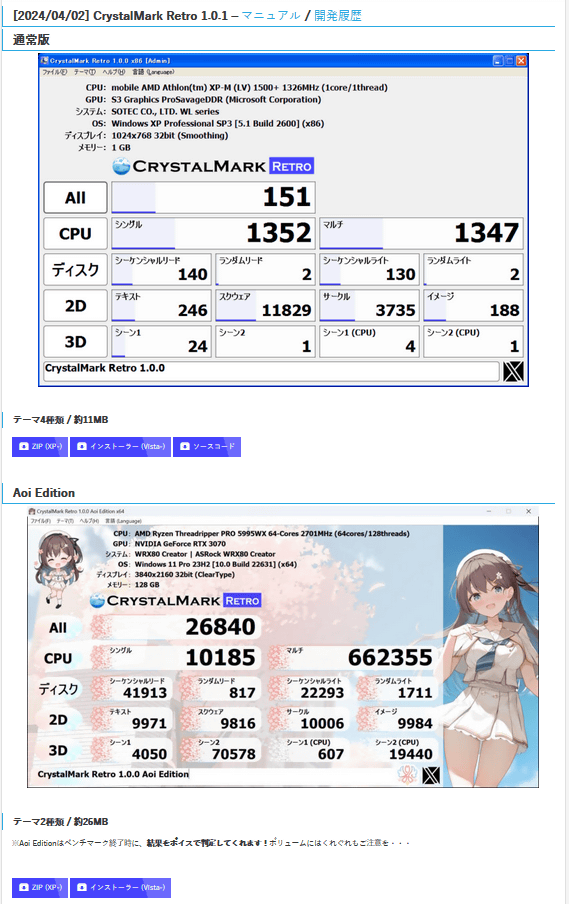
This time I decided to use the regular version of CrystalMark Retro. CrystalMark Retro is distributed in ZIP and installation formats. This time, click “ZIP” to download the ZIP format.
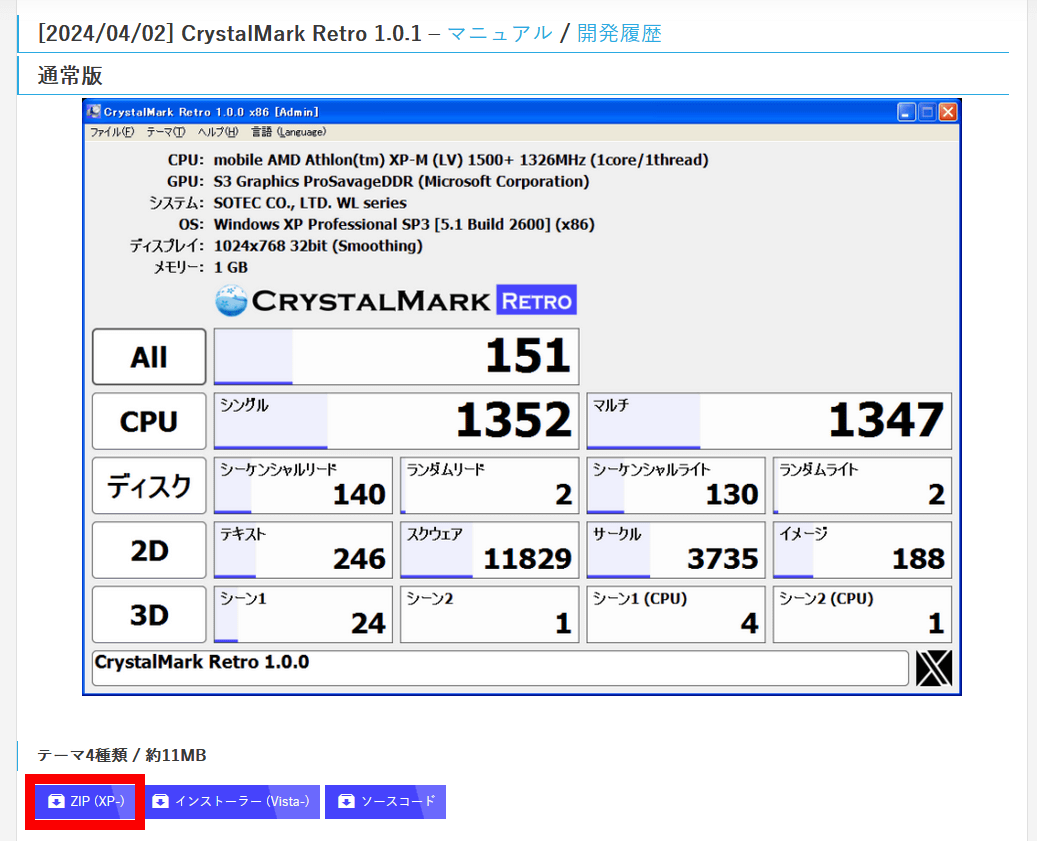
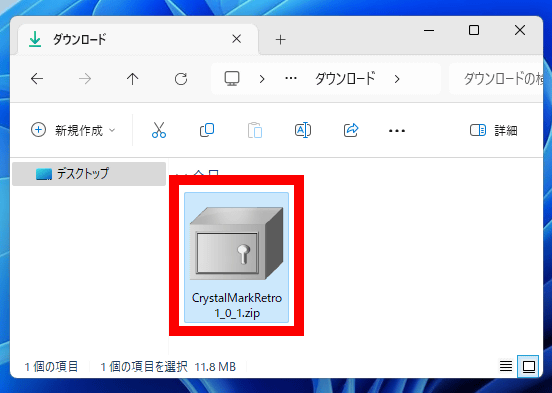
When you click “ZIP”, the page below will open and the download will start automatically.

Once you download the zip file, extract it using standard Windows functions or compatible software.
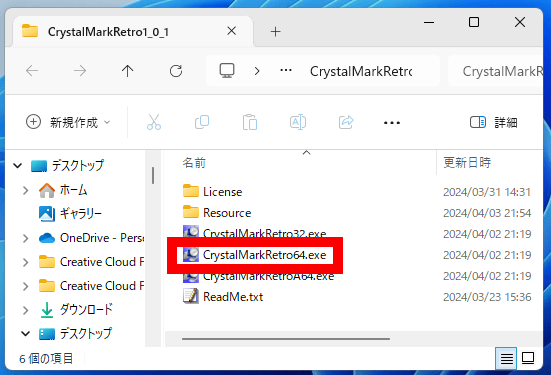
When you extract the ZIP file, it will show the 32-bit version “CrystalMarkRetro32.exe”, the 64-bit version “CrystalMarkRetro64.exe”, and the Arm version “CrystalMarkRetroA64.exe”. This time, I double-clicked “CrystalMarkRetro64.exe” to start the 64-bit version of CrystalMark Retro.
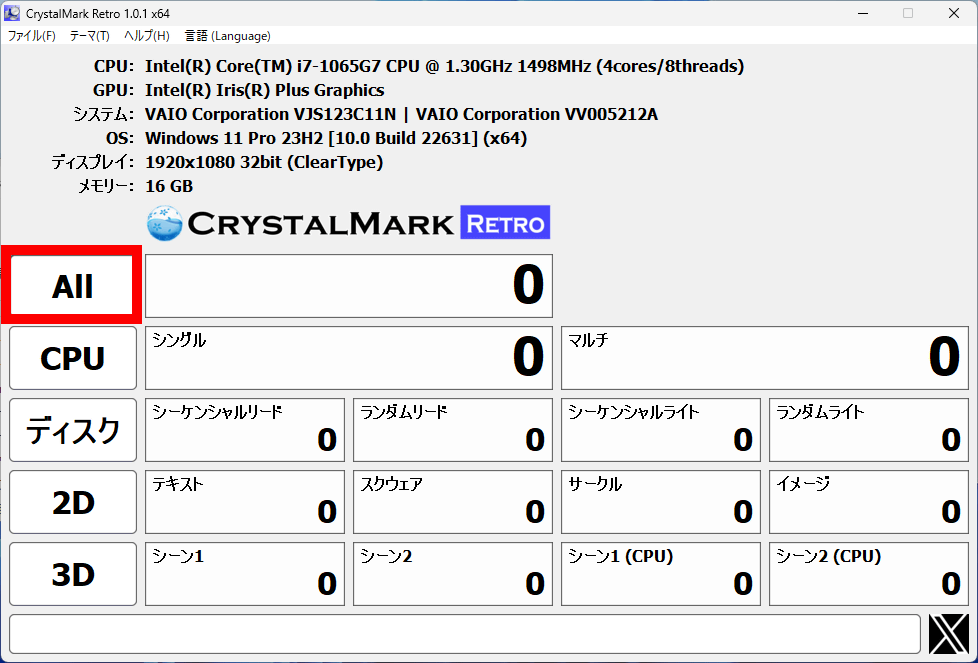
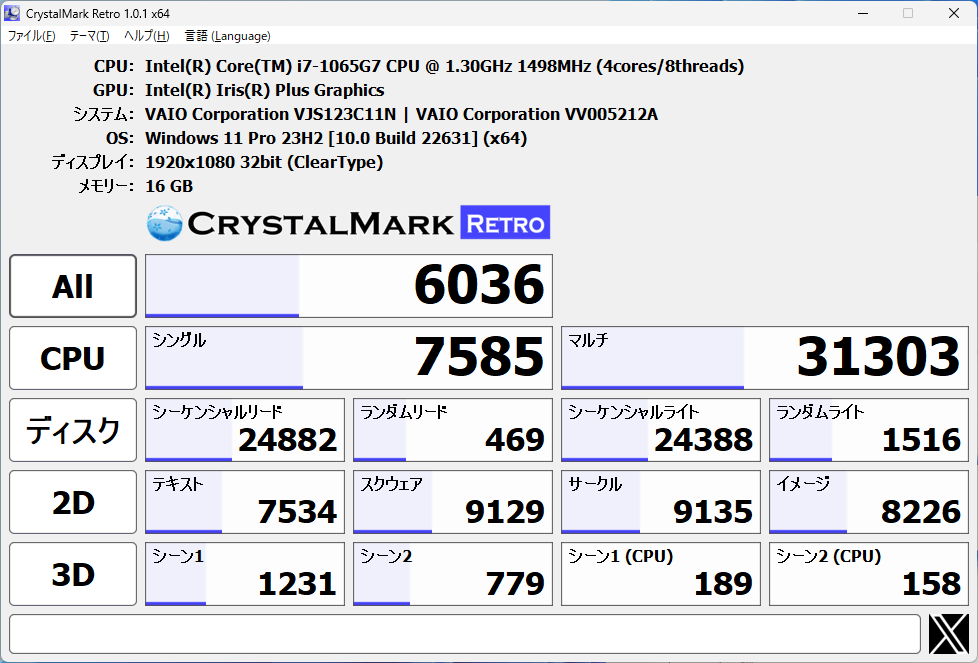
When you start CrystalMark Retro, information such as your computer's central processing unit (CPU) and graphics processing unit (GPU) will be displayed at the top of the screen. Click “All” to run all performance metrics at once, and click “CPU,” “Disk,” “2D,” or “3D” to run the corresponding benchmarks one by one. This time, I wanted to know the overall performance of my computer, so I clicked All.
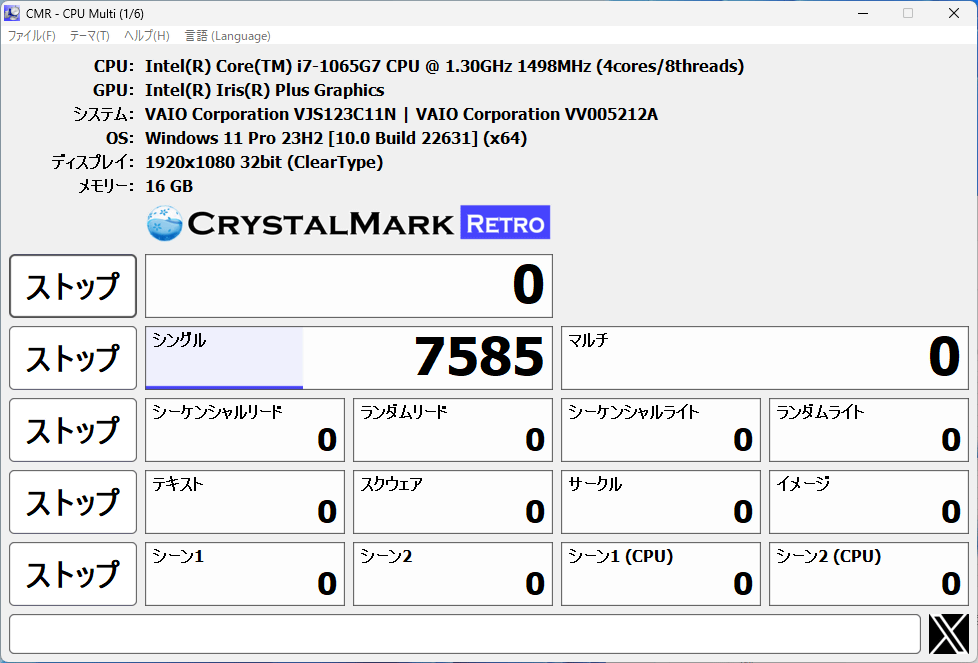
When the benchmarking starts, the various buttons will change to “Stop” and the completed benchmarking results will be displayed in order. The performance measurement may take more than 10 minutes depending on your computer, so please wait a while.
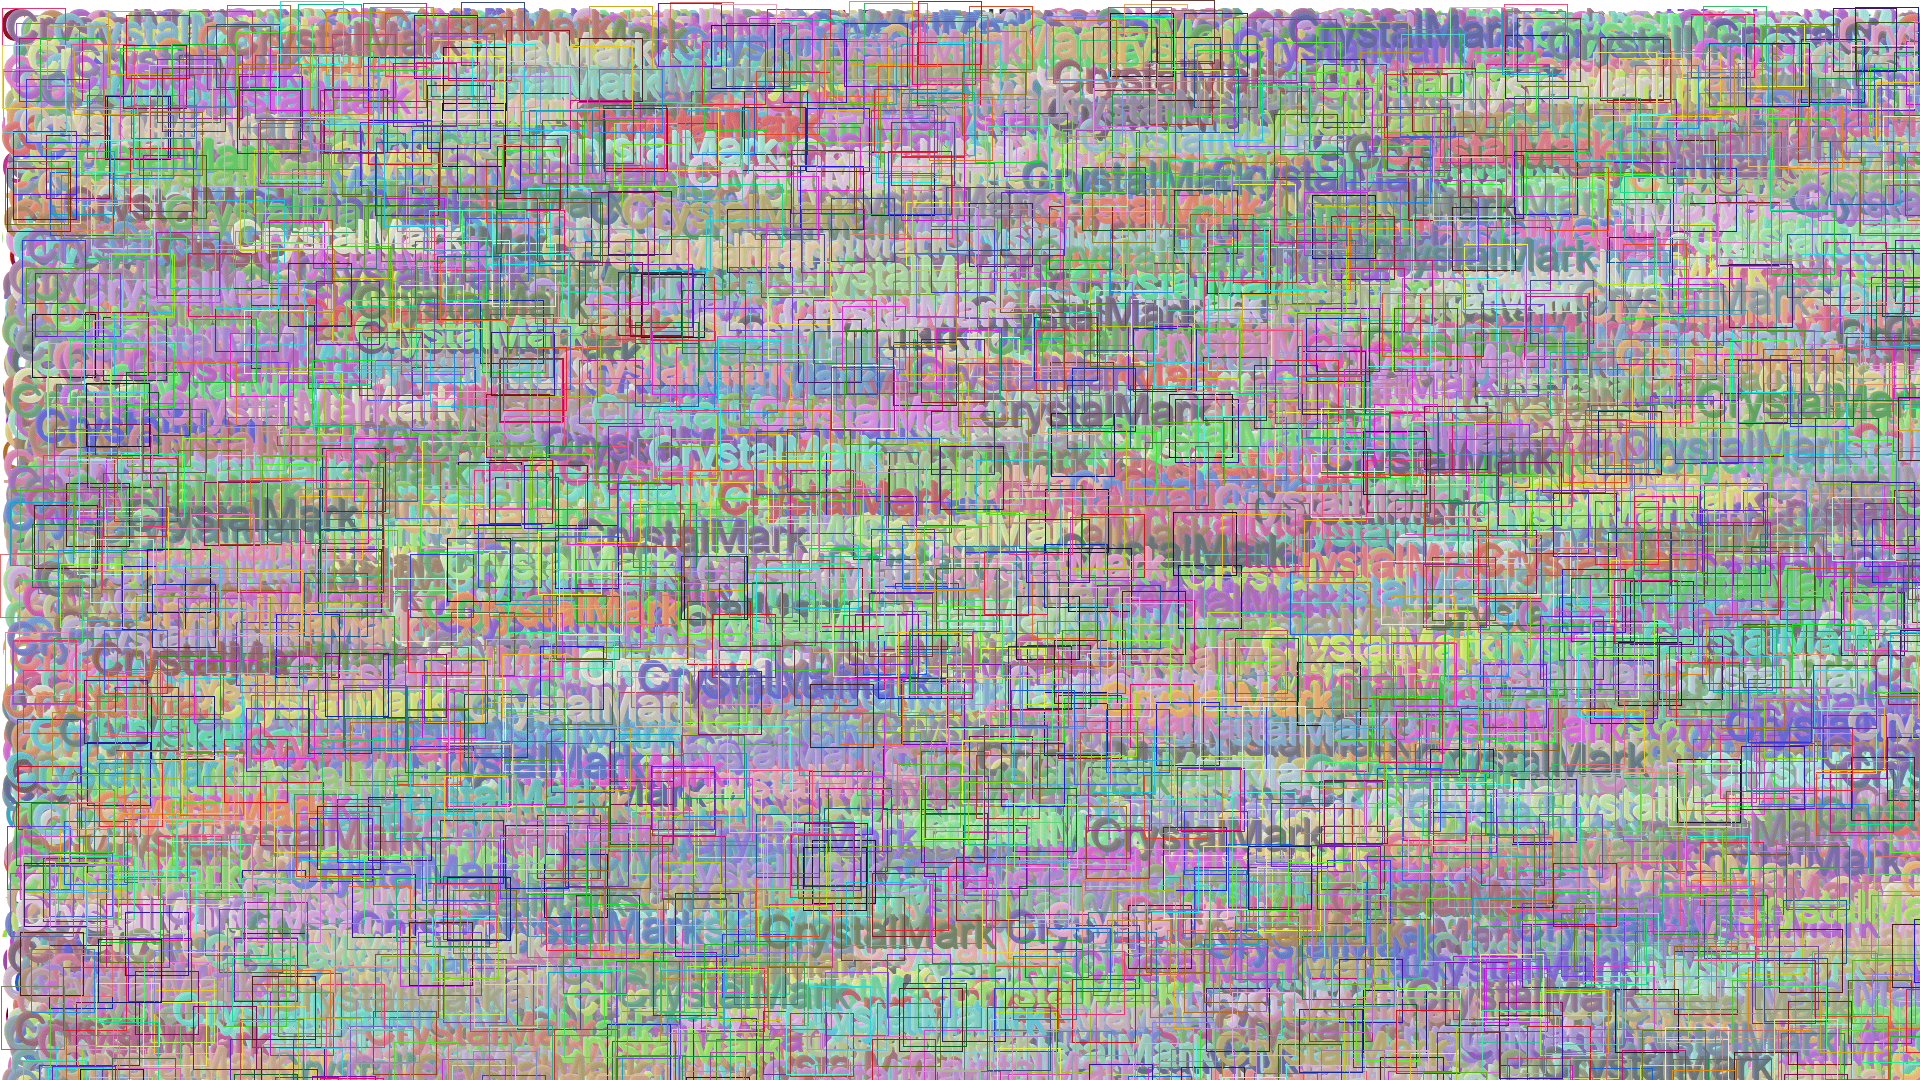
During the benchmark test, the following pattern will be displayed in full screen, but this is not an issue as it is for measuring graphical performance. If you wait for a while, the screen will automatically return to the original screen.
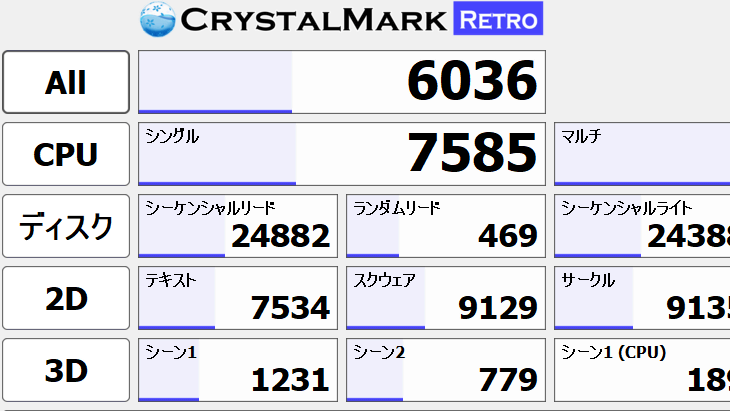
When the performance test is completed, the single-core CPU performance, multi-core performance, storage read/write performance, 2D graphics performance, and 3D graphics performance are displayed as shown below.2020 model Vaio SX12As a result of running the benchmark, the overall score was 6036 points, the CPU core score was 7585 points, the multi-core score was 31303 points, the sequential read was 24882 points, and the sequential write was 34388 points.
The calculation criteria for each score are as follows. Responsible for developing the OpenGL (3D) benchmark part.QuinickHe said the 3D standard was designed to “equally benchmark everything from 20-year-old integrated video cards to the latest GPUs.”
| Species | Calculation standards |
|---|---|
| everyone | Geometric mean calculated using the following ratios CPU 40% (Mono 20%, Multi 20%), Disc 20% (5% each), 2D 20% (5% each), 3D 20% (Scene 1 5%, Scene 2 15% ) |
| CPU | AMD Ryzen Threadripper PRO 5995WX Single Core Score Revised to 10,000 Points |
| disk | 10x MB/s The target is the drive where Windows is installed (usually C drive). The test file is 1 GB. |
| 2D(GDI) | Adjusted so that each score is 10,000 points in an AMD Ryzen Threadripper PRO 5995WX + GeForce RTX 3070 environment |
| 3D (OpenGL) | 1/10 of the number of polygons drawn divided by the running time |
Copy the title and URL of this article

“Travel maven. Beer expert. Subtly charming alcohol fan. Internet junkie. Avid bacon scholar.”
More Stories
The “FFXIV: Golden Legacy Benchmark” is scheduled to be replaced in the second half of the week of May 23. Many bugs such as character creation screen, etc. have been fixed.
Sleep without your iPhone alarm going off! ? Causes and Countermeasures to Wake Up with Peace of Mind – iPhone Mania
A close-up image of the dark nebula “Horsehead Nebula” observed by the Webb Space Telescope |