


- Bitcoin faced resistance at $67,583; Breaking this level could lead to a move towards $70,000.
- The RSI and MACD are showing weak momentum, while rising active headlines indicate potential bullish activity.
Bitcoin [BTC] It fell below $67,000, hitting an intraday low of $65,700 after giving up overnight gains. At a price $66,972.95 At press time, it shows a decline of 1.22% over the past 24 hours and 2.01% over the past week.
Despite the short-term decline, Bitcoin's market cap remains at $1.32 trillion, with a circulating supply of 20 million BTC. In the past 24 hours, trading volume reached $46.32 billion, reflecting the continued interest from traders.
Bitcoin is trading within a clear bearish channel. This pattern shows a series of lower highs and lower lows, indicating a downtrend.
The upper border of this channel, near $69,000, has repeatedly served as a strong resistance level, pushing prices lower after each attempt to break it.
As shown in the chart, recent rejections have followed similar patterns, suggesting that this resistance remains a key challenge for further gains.
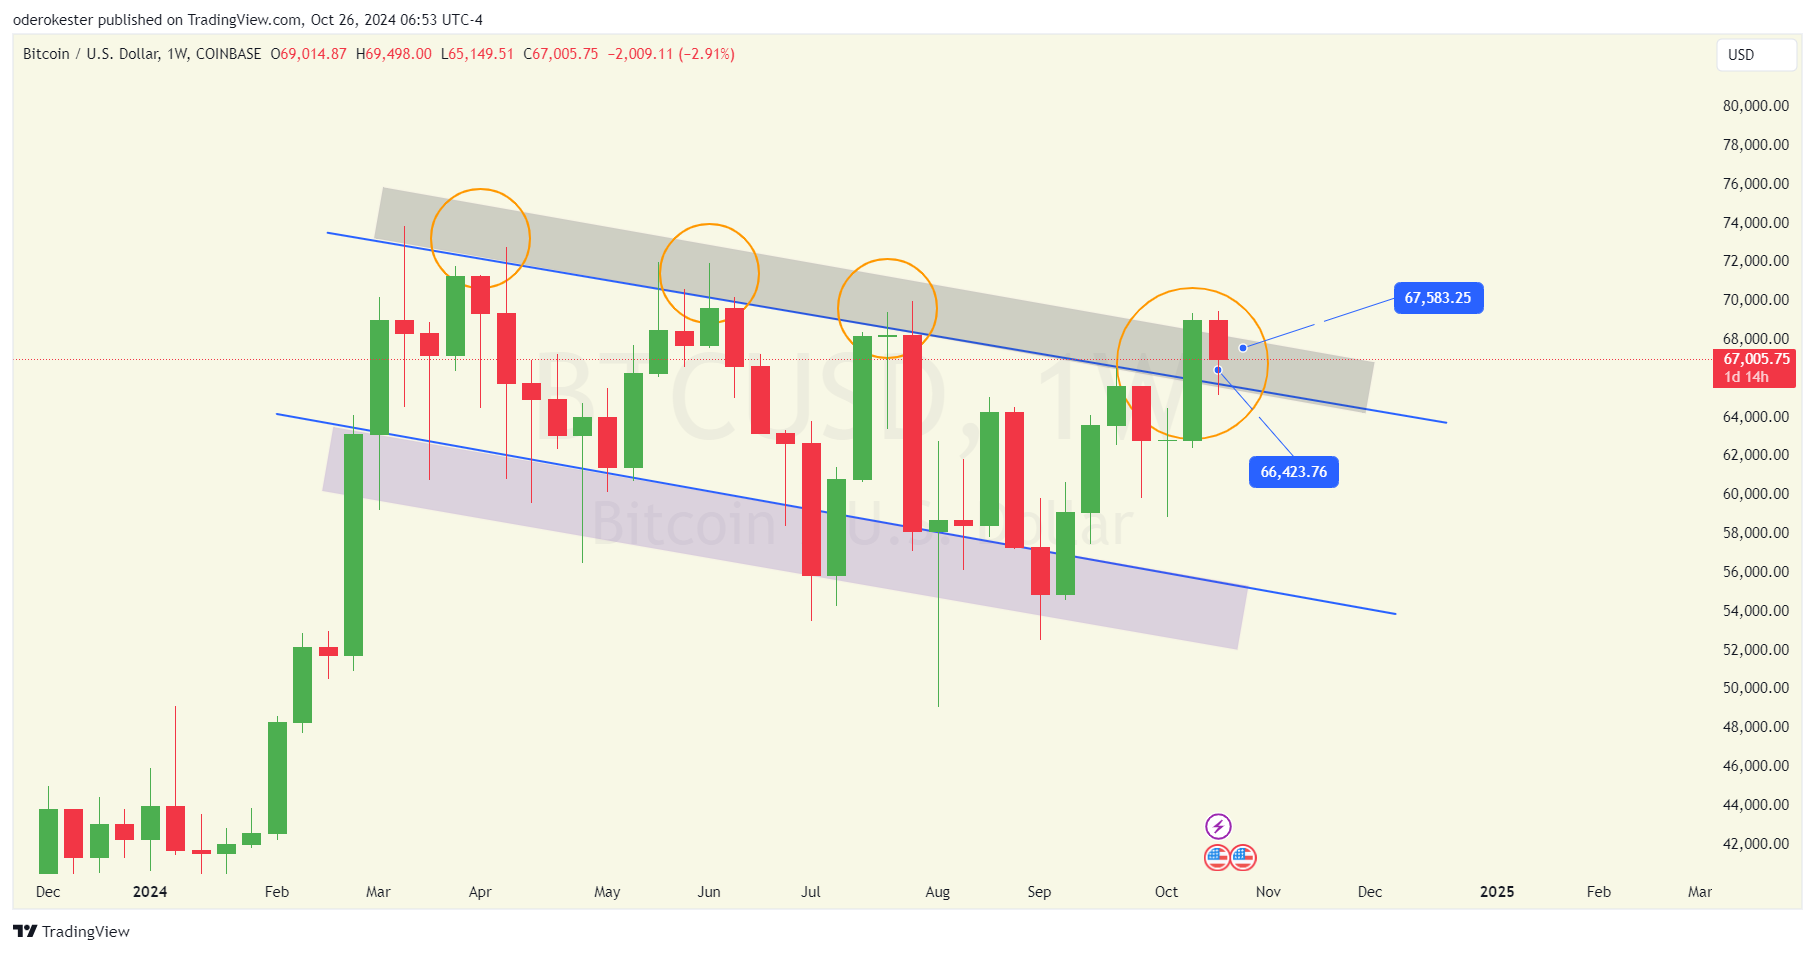
Source: Trading View
Support and resistance levels
Bitcoin's upper resistance area at press time was between $67,583.25 and $69,000, a range that has consistently rejected upward attempts.
If Bitcoin can break above this range, it could pave the way for an extended move towards $70,000.
However, failure to cross this level could result in Bitcoin falling back into the downward channel.
Immediate support was identified around $66,423.76, which was marked as a critical level on the chart. If Bitcoin breaks this support, it could fall towards the lower limit of the channel, expected between $60,000 and $62,000.
RSI and MACD analysis
At the time of publishing, the Relative Strength Index (RSI) is at 56.75, and lies below the signal line at 63.00. This indicates that the bullish momentum is weakening and approaching more neutral territory.
Meanwhile, earlier in October, the RSI rose above the 70 level, indicating overbought conditions. The subsequent decline indicated a correction, but the current RSI level still allows room for upward movement.
Staying above 50 is important for continued bullish momentum.
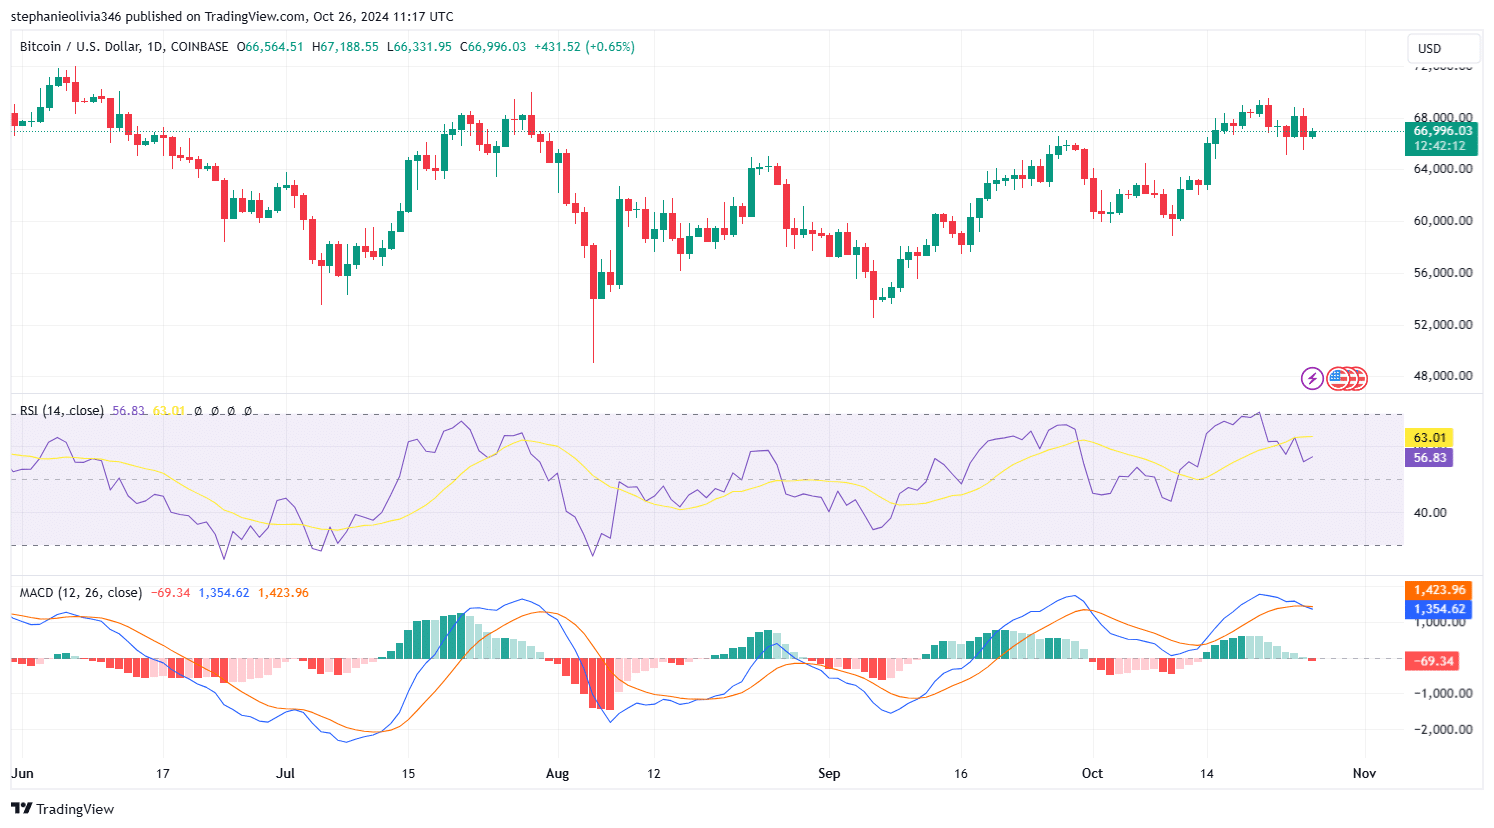
Source: Trading View
The moving average convergence and divergence (MACD) line remains above the signal line, indicating a continuation of the uptrend. However, shrinking chart bars indicate declining momentum.
If the MACD line crosses below the signal line, this may indicate a short-term downtrend or a period of consolidation.
On-chain activity
according to IntoTheBlock According to the data, active Bitcoin addresses increased by 5.20% in the past week, indicating increased user engagement.
This contrasts with a 6.50% decline in new addresses, suggesting that existing users were driving network activity.
The 7-day average Bitcoin transaction volume was 539.81K BTC at press time, with a recent peak of 672.53K BTC on October 22 and a low of 371.37K BTC on October 20.
Source: IntoTheBlock
Read Bitcoin [BTC] Price forecasts 2024-2025
The fluctuating volume reflects a change in market activity, with a recent rise indicating increased participation.
This variation in transaction volume indicates ongoing changes in trading patterns, which could shape Bitcoin price movements in the coming days.

“Extreme travel lover. Bacon fanatic. Troublemaker. Introvert. Passionate music fanatic.”
More Stories
British Airways has canceled all flights between New York and the UK's main airport until 2025 – Travel
CEO reveals surprising answer to interview question that won't get you the job
Could Elon Musk's alliance with Donald Trump hurt Tesla's business? Not according to the company's list of “risk factors.”